Lifestyle
Customer Journeys and Marketing Funnels: Find Where Readers Drop Off
Customer journeys explain touchpoints and needs; marketing funnels count people at each step using consistent criteria. Using an original bicycle repair booking example, this article explains how to map online and offline contacts, define completion events, calculate step conversion rates, and set up GA4 open or closed funnels. A calculation table, practical steps, and original diagrams help identify improvement hypotheses to test without mistaking data gaps for causes of customer drop-off.
About 8 min read
Contents
- 1. Journey maps explain experiences; funnels explain steps
- 2. Map the current experience using touchpoints and evidence
- 3. Define events and completion criteria before interpreting the funnel
- 4. Calculate step conversion rates using consistent criteria
- 5. Rule out recording issues before investigating behavior
- 6. Make improvement hypotheses testable
A bicycle repair shop notices that many people view its booking page but never submit the form. Some may call instead, some may still be checking their bicycle model, and others may go straight to the shop. A single conversion rate cannot tell you what each customer does next, much less establish that the form is too long.
This article explains how journey maps and funnels work together, drawing on Google Analytics documentation and user research resources consulted on 2026/9/14. The repair shop process, figures, and proposed improvements are original examples. They involve no connection to real accounts or operation of a live website, and do not represent actual conversion results.
Journey maps explain experiences; funnels explain steps
A customer journey starts with a person's task and maps what they do at different stages, which services they encounter, and what problems they face. It can span search, websites, phone calls, in-person visits, and subsequent use. A marketing funnel selects specific steps to observe and counts how people who meet the criteria advance to the next step.
Their scope can differ. A repair journey might begin with noticing an unusual noise and end with confirming that the problem is resolved after collecting the bicycle. A website funnel might cover only reading about services, viewing time slots, starting the form, and submitting a booking request. Do not treat the final online step as completion of the entire service, or count everyone outside the funnel as a failure.
First decide which problem to improve, such as helping people who need routine maintenance complete a suitable booking. If the processes for urgent breakdowns and routine maintenance differ greatly, study them separately. Forcing different needs into a single map may make every stage look reasonable without guiding any concrete changes.
Map the current experience using touchpoints and evidence
First list the places customers might interact with the business, then verify them through interviews, inquiry records, and actual service processes. At each stage, record what customers want to accomplish, the channels they use, the information they need, the obstacles they currently face, and who handles the work internally. For anything unknown, mark it rather than inventing details just to fill out the process map.
The original repair example can be divided into understanding the problem, confirming the service, arranging a time slot, dropping off the bicycle, and checking it at pickup. Search pages may explain the scope of services, the booking page provides available time slots, phone calls help clarify uncertain needs, and an in-person visit confirms what needs inspection. These touchpoints connect with one another; the website is just one part.
Emotions and thoughts also need evidence. Seeing a customer remain on a page does not justify labeling them as anxious. First record the observed pause or incomplete action, then use research to understand the reason. Keep evidence of the current experience, team hypotheses, and the ideal process separate in the journey map so that the next reader does not mistake a design goal for an observed fact.
Define events and completion criteria before interpreting the funnel
First write identifiable criteria for each step. Reading the service page, viewing time slots, starting the form, and submitting successfully should each have a distinct definition. Clicking the submit button and receiving an error message does not count as a successful submission. Nor does delivery of the form mean the shop has accepted the booking; subsequent confirmation can be recorded separately.
In GA4, you can create a funnel exploration from Explore, then set event or dimension conditions. A closed funnel requires entry at the first step, while an open funnel allows entry at an intermediate step. Directly followed steps allow no intervening actions; indirectly followed steps do. Match the conditions to the analytical question, and document the date range, step sequence, and time limits.
GA4 counts funnel steps in the specified order. Repeated completions by the same user during the selected period do not each add another funnel record. If you need to study every order or repair, use the corresponding records separately. Do not put user counts, event counts, and order counts in the same table and simply divide one by another.
Calculate step conversion rates using consistent criteria
Suppose that in a single closed funnel, 240 people read about the services, 120 of them view time slots, 90 then start the form, and 45 finally submit successfully. These original example counts represent people who meet the step criteria in sequence during the same period under the same conditions. They are not totals pieced together from four unrelated reports.
The step conversion rates are 120 divided by 240, or 50%; 90 divided by 120, or 75%; and 45 divided by 90, or 50%. The overall completion rate is 45 divided by 240, or 18.75%. Step and overall rates have different denominators. Label them clearly in reports so readers know which question each figure answers.
At the first transition, 120 people do not advance; at the last, 45 do not. The proportion not advancing is 50% in both cases, but that does not mean both need the same measures. The former may include people who only want information, while the latter may be more closely related to difficulties using the form. Consider the number of people affected, service goals, improvement costs, and research evidence together, rather than simply choosing the largest red block.
Rule out recording issues before investigating behavior
Check whether events fail to send, trigger repeatedly, or count failed submissions as successes. You can enable debug mode on your own test device, use DebugView to check events and parameters, then walk through both successful and failed processes. Google notes that privacy controls or a lack of consent to analytics cookies may prevent debug events from appearing.
Next, check whether customers switch to phone calls, in-person visits, or other entry points. Differences in devices, periods, and identification criteria also affect which paths you can connect. If reliable linking is not possible, report the website funnel and in-store booking records separately, noting the scope you can observe. Do not fill gaps with guesses to create an apparently complete cross-channel conversion rate.
Only then propose behavioral hypotheses. For example, not completing the form after starting it might be related to difficulty answering the bicycle model field, or simply to unsuitable time slots. Observing people who meet the criteria as they use the form and reviewing relevant inquiries can help narrow down the reasons. The numbers identify where investigation is worthwhile; the causes still need supporting evidence.
- Choose one customer task and map current touchpoints and data gaps.
- Define each step's event and success criteria, then check what actually triggers.
- Hold funnel entry criteria, sequence, period, and denominators consistent, and calculate step and overall rates.
- Use research to select one improvement, then review its results using the same criteria.
Make improvement hypotheses testable
Write the hypothesis as an actionable statement, such as: “If not knowing the bicycle model prevents people from filling in the form, instructions on where to find it should reduce pauses at this field.” This is easier to evaluate than “improve the experience.” Assign an owner, a completion deadline, and an observation method, and retain the previous version and the conditions used to collect the data.
You can first ask a few people who fit the scenario to try the revised form and check whether the instructions help. When quantitative comparison is needed, design an appropriate method based on traffic and the risks of the decision. A rise in conversion rate over one week does not rule out the effects of seasonality, visitor sources, or changes in service hours, and does not justify claiming that the revision caused growth.
Also check downstream quality. More submissions do not fulfill the original goal if booking details are incomplete, the shop cannot respond, or many requests fall outside its services. Include valid bookings, shop visits, and service outcomes in the journey review to avoid shifting problems to the next stage merely to make the funnel chart look better.
Read the full description
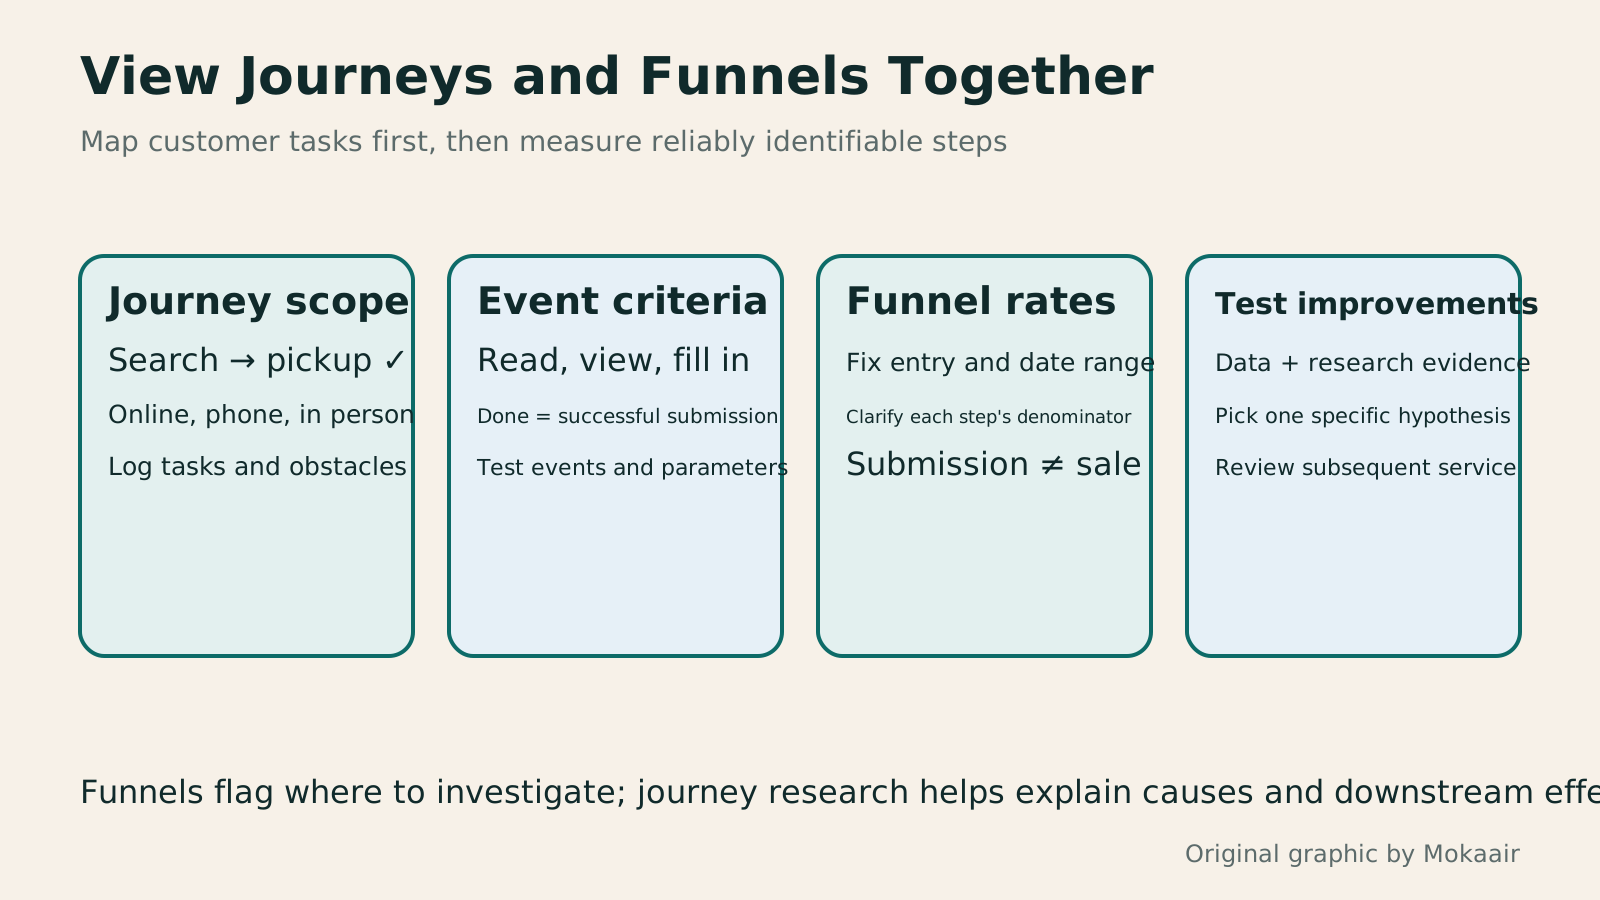
Four columns distinguish touchpoints, event criteria, funnel denominators, and improvement testing, showing that website submission is only part of the repair service journey.
| Closed funnel example | People meeting the steps in sequence | Relative to the previous step |
|---|---|---|
| Read about services | 240 | Starting point |
| View time slots | 120 | 120 ÷ 240=50% |
| Start the form | 90 | 90 ÷ 120=75% |
| Submit successfully | 45 | 45 ÷ 90=50% |
Build evidence-based personas through interviewsSTP and Personas: Use Interview Evidence to Decide Whom to ServeSTP helps a team decide whom to serve; personas help it understand customers' tasks and obstacles. Both need evidence. Using a fictional home-organizing service, this guide covers interview planning, separating observations from assumptions, segmenting by need, selecting a target, and testing a position. An evidence table, practical steps, and an original diagram help you avoid inventing a convincing customer from age and imagination alone.Read the full article
Check WordPress forms and submission resultsWordPress contact forms: fields, spam protection, and delivery checksA contact form must be easy for visitors to complete and reliable for the site owner to receive and follow up. Using Contact Form 7, this guide covers field design, mail templates, reply addresses, Turnstile spam protection, and message storage with Flamingo. It gives Taiwan-based small-site owners phone and inbox checks so an on-screen success message is never mistaken for a completed contact process.Read the full article
Schedule improvements in a small shop's marketing planHow to write a small-shop marketing plan: goals, customers, and monthly reviewsA small-shop marketing plan can begin with one clear business problem; there is no need to schedule every social channel and ad at once. Using an original example about a florist's weekday orders, this guide works through goals, customers, channel roles, budgets, and monthly reviews. It provides practical worksheet fields, a comparison table, and an original diagram so owners can turn ideas into assigned, trackable actions they can revise. Completing a campaign is not a promise of sales.Read the full article
Found this guide helpful? Share it with someone who needs it
Lifestyle
How to Read the BCG Matrix: Uses and Limits of Product Portfolio Analysis
The BCG matrix maps product portfolios by market growth and relative share; stars, cash cows, question marks and dogs do not establish actual profit. An original home goods store example shows how to define markets, check comparison periods and denominators, understand model assumptions, and allocate resources using costs, turnover and customer needs. Includes a four-category table, practical steps, original diagrams and options when reliable market data is lacking.
Lifestyle
How to Use the Ansoff Matrix: Four Options for Expanding Products and Markets
The Ansoff matrix maps four growth paths using existing or new products and markets: market penetration, market development, product development and diversification. An original canvas goods studio example shows how to define the current business and compare the capabilities and evidence each path needs. A comparison table, steps and original diagrams turn growth ideas into small, testable plans, without treating the model as a success-rate table.
Lifestyle
How to Write Marketing Copy: Clarify Value, Conditions, and Next Steps
Marketing copy should explain who it suits, its value, conditions, and what happens next. Using an original journal-binding workshop example, this article revises information hierarchy, features and benefits, evidence for claims, and action buttons step by step. A before-and-after table and original diagrams show how to retain appeal without overstating promises, and check that prices, limits, images, and links align before publication.
Lifestyle
Planning Brand Identity: CIS, Logos and Website Colors
Brand identity connects business ideas, public-facing behavior and visuals; a logo is only one part. Using an original example of a desk-side stationery studio, this guide covers CIS, MI, BI and VI basics, brand briefs, logo use and website color rules, with steps, a comparison table and original diagrams. It helps small brands clarify uses and acceptance criteria before commissioning design, avoiding a delivery of image files without guidelines they can keep using.
Articles that cite this one
- Practicing Design Thinking: From Interviews to Small, Testable Prototypes
- How to Start a Web Design Project: Requirements, Content, and Acceptance Testing in Order
- Plan Social Content: Topics, Conversation, and Moderation Boundaries
- Planning a Content Marketing Calendar Around Reader Questions and Updates
- SWOT and TOWS: From Strengths and Weaknesses Analysis to an Action List
- B2B, B2C and D2C: Customers, Sales Processes and Marketing Priorities
Sources
- Google Analytics Funnel ExplorationChecked:
- Google Analytics: Monitoring Events in DebugViewChecked:
- GOV.UK: Creating Experience MapsChecked:
- NN/g: Customer Journey Mapping ConceptsChecked:
Compiled from the references and verification dates listed above; fares, schedules, product features, and terms can change, so please confirm the latest details on the relevant official website before travelling, booking, or purchasing.