Lifestyle
How to Read the BCG Matrix: Uses and Limits of Product Portfolio Analysis
The BCG matrix maps product portfolios by market growth and relative share; stars, cash cows, question marks and dogs do not establish actual profit. An original home goods store example shows how to define markets, check comparison periods and denominators, understand model assumptions, and allocate resources using costs, turnover and customer needs. Includes a four-category table, practical steps, original diagrams and options when reliable market data is lacking.
About 8 min read
Contents
- 1. First Understand the Two Axes and the Model's Assumptions
- 2. Market Boundaries Determine Whether Figures Are Comparable
- 3. Separate Market Growth from the Store's Sales Growth
- 4. Use the Four Quadrants to Ask Questions, Not Directly Decide What Stays
- 5. When Data Is Limited, Use an Evidence-Based Product Review
- 6. Keep Checking Results and Limitations After Allocating Resources
A home goods store sells three categories: desktop storage, fabric storage and on-the-go accessories. The owner wants to decide where to spend time next season. Simply calling the store's bestsellers cash cows and its latest launches question marks can lead to misuse of the BCG matrix, because these names also incorporate market and competitive conditions.
This article explains how to interpret the data, drawing on BCG's original article, official model explanation and subsequent reviews consulted on 2026/9/14. The home goods store, product groups and calculation figures are all original examples, with no real market survey, and do not constitute an investment assessment of any company or product.
First Understand the Two Axes and the Model's Assumptions
The BCG growth-share matrix organizes product or business portfolios by market growth rate and relative market share. Its four categories are stars with high growth and high share, cash cows with low growth and high share, question marks with high growth and low share, and dogs with low growth and low share. Official historical articles also use the name pets.
An important premise of this model links leading scale and experience to cost advantages, while examining how growing businesses require resources and mature businesses may provide them. It offers a framework for discussion. It does not mean that every high-share product has the same profitability, or that every low-share product lacks value worth retaining.
Before using it, ask what you are allocating, such as purchasing resources, display space or development hours. Different decisions may require different data. If the owner's real concern is excess inventory, directly examining turnover and demand may be more useful. There is no need to assign every product an animal name just to use the model.
Market Boundaries Determine Whether Figures Are Comparable
First define the unit of analysis: an individual item, a product group or an entire business. If the home goods store compares desktop storage with on-the-go accessories, it must specify each category's market scope, region, customer uses and data period. You cannot divide one product's monthly revenue by annual nationwide sales across different categories.
Market boundaries that are too broad may obscure actual competition, while overly narrow boundaries may deliberately make your share look high. The original example could begin by studying "the desktop storage category in a specified region and sales channel," listing which products are included and excluded. If the data covers only some platforms, state that scope explicitly rather than claiming it represents the entire market.
Revenue and unit sales must also be measured consistently. Rising prices may increase revenue without necessarily increasing the number of units purchased; unit counts for products with different specifications may not be directly comparable either. Data sources, currencies, periods and statistical methods must be consistent before growth and relative position can be meaningfully discussed.
Separate Market Growth from the Store's Sales Growth
Suppose annual sales in the defined market, expressed in tens of thousands of dollars, rise from 1,000 to 1,100. The market growth rate is the increase of 100 divided by the previous period's 1,000, or 10%. This is a calculation example for this article. You cannot enter 40% as the market growth rate simply because sales of your own products increased by 40%.
Relative market share requires a clearly stated comparison. This example divides your market share by that of the largest competitor: if they are 20% and 40% respectively, the result is 0.5, meaning the former is half the latter. This ratio does not mean your own market share is 50%, nor is it the probability of future success.
The basis for the high/low thresholds must also be specified; a single growth percentage should not be arbitrarily applied across all industries. Different studies may use different benchmarks. BCG's 2014 retrospective study, for example, used its own specific data definitions. When reading someone else's chart, check the methodology and notes first rather than assuming that all relative market share figures use exactly the same denominator.
Use the Four Quadrants to Ask Questions, Not Directly Decide What Stays
If a product group occupies a relatively leading position in a high-growth market, ask what resources are needed to maintain supply, quality and service. For a relatively leading group in a slower-growing market, check whether it actually has stable demand and cash available for use. Stars and cash cows are analytical categories, not titles that guarantee results once applied.
For product groups in high-growth markets that lag behind competitors, examine the reasons for the gap, the investment required and whether there are verifiable ways to improve. For low-growth, low-share products, first investigate their actual uses: they may serve a small group of specific customers, complement other products or consume excessive support time. This information is needed before deciding whether to retain, adjust or discontinue them.
The home goods store should not remove an accessory category simply because it falls in the low-growth, low-share quadrant. First check whether it supports the use of existing products and what alternatives customers would need if supply ended. These are operational questions this article recommends investigating further; they do not mean the model has proven that the item has value or should be discontinued.
- Define the product group, market, region, period and resources to be allocated.
- Verify the sources, denominators and high/low thresholds for market growth and relative market share.
- Examine the classification alongside actual demand, costs, turnover and service obligations.
- Choose a conditional resource allocation plan, set a review date and retain new evidence.
When Data Is Limited, Use an Evidence-Based Product Review
Small stores may lack access to complete market-size or competitor data. When reliable figures cannot be found, mark them as unknown. Social media follower counts, your own website traffic and each product's share of store sales cannot substitute for market share. If you switch to other metrics, rename the analysis so readers do not mistake it for a standard BCG interpretation.
Start by creating a product review table that records sources of demand, recent sales, time in inventory, production or purchasing burdens, after-sales issues and relationships with other products. These data will not calculate market position, but they can help identify which products merit restocking, which information needs improvement and which issues should be investigated first.
If some market estimates are available, list credible ranges and examine whether the classification changes under different reasonable assumptions. If the results readily cross a threshold, rely less on the labels and gather more data first. A chart's precise appearance does not mean its underlying data are equally precise. In particular, do not present estimates as actual survey findings.
Keep Checking Results and Limitations After Allocating Resources
In its 2014 retrospective, BCG noted that the relationship between market share and sustained performance needed re-examination, and emphasized faster experimentation and adjustment. When citing this discussion, treat it as observations from research at that time and methodological guidance. Do not directly apply percentages from an older study's sample to small stores in Taiwan today.
For implementation, first clearly define one task, such as improving a product group's descriptions and supply information, then observe whether demand becomes clearer and handling costs remain acceptable. If you add new-product tests, also confirm that service and supply for existing products can be maintained. Resource allocation requires considering overall capacity as well as new ideas.
During reviews, examine both the basis for classification and operational results. If market boundaries, comparison targets or data methods change, note that the earlier and later results are not directly comparable. If demand and costs differ from the original expectations, adjust the plan. The matrix is most useful for helping a team articulate portfolio trade-offs, rather than assigning every product a fixed fate.
Read the full description
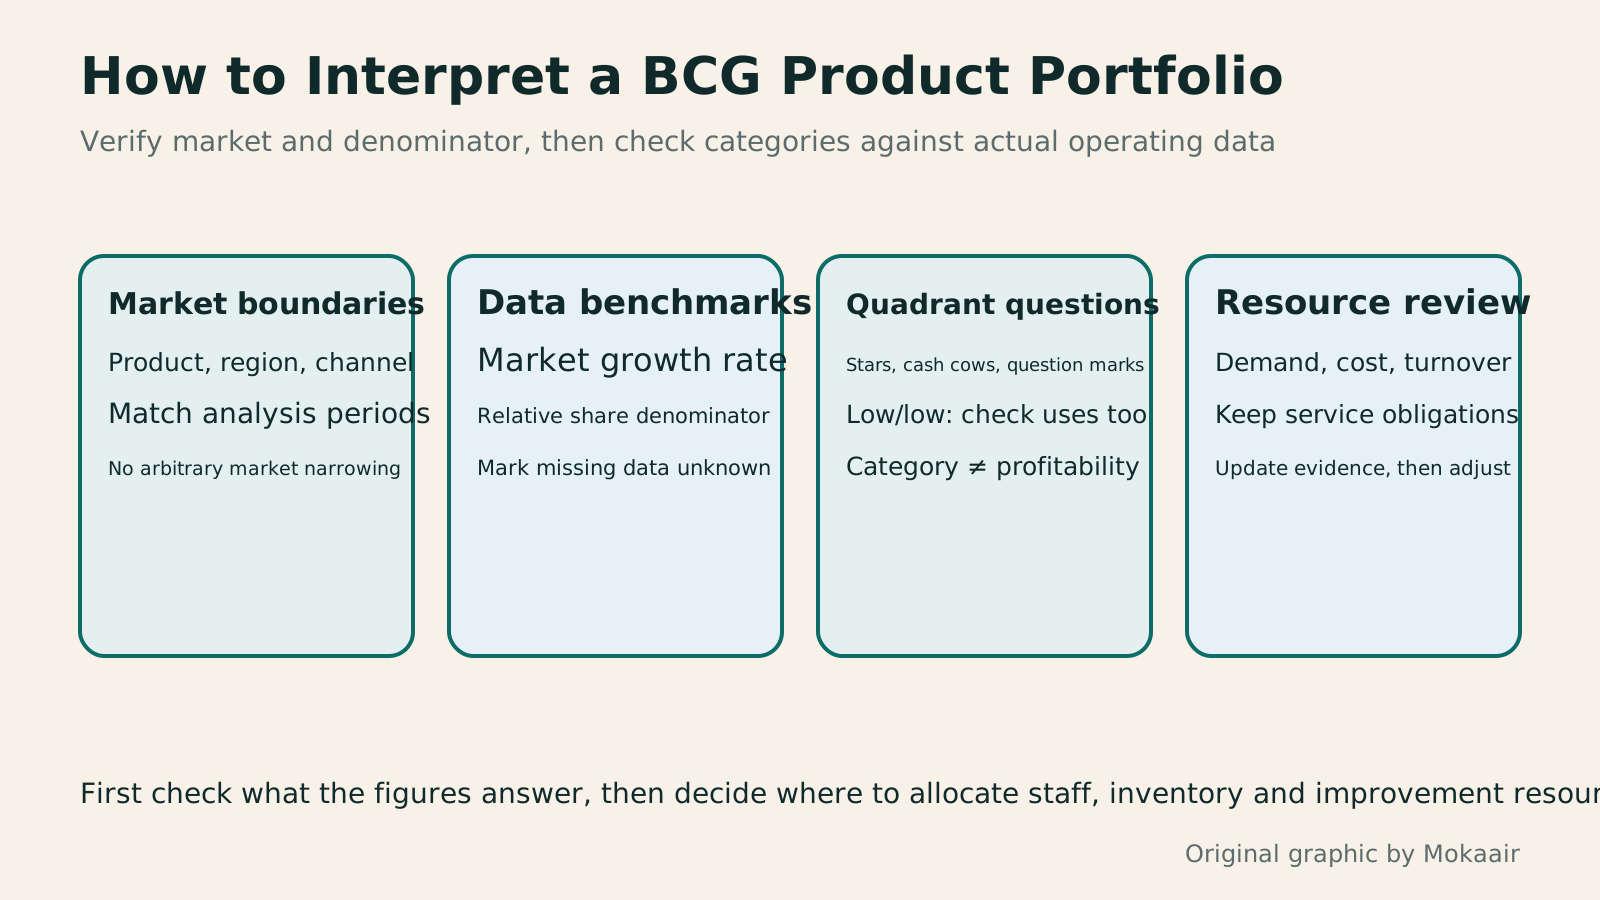
Four columns show market boundaries, data benchmarks, quadrant questions and resource reviews, stressing that chart categories cannot replace judgments on profit or whether to keep a product.
| Category | Market Growth / Relative Market Share | Questions to Check Next |
|---|---|---|
| Stars | High / High | How many resources are needed to maintain supply and service? |
| Cash cows | Low / High | Are demand and available cash actually stable? |
| Question marks | High / Low | Can the reasons for the gap and the investment needed to improve be verified? |
| Dogs / pets | Low / Low | Actual burdens, customer uses and relationships within the portfolio |
How to Use the Ansoff Matrix: Four Options for Expanding Products and MarketsHow to Use the Ansoff Matrix: Four Options for Expanding Products and MarketsThe Ansoff matrix maps four growth paths using existing or new products and markets: market penetration, market development, product development and diversification. An original canvas goods studio example shows how to define the current business and compare the capabilities and evidence each path needs. A comparison table, steps and original diagrams turn growth ideas into small, testable plans, without treating the model as a success-rate table.Read the full article
SWOT and TOWS: From Strengths and Weaknesses Analysis to an Action ListSWOT and TOWS: From Strengths and Weaknesses Analysis to an Action ListSWOT maps strengths, weaknesses, opportunities and threats, but filling its four boxes still leaves actions to choose. Using an original small print studio example, this article separates internal and external factors, adds evidence to each judgment, and develops options with the four TOWS pairings. A strategy comparison table, practical steps and original diagrams turn vague adjectives into a task list with owners, deadlines and acceptance criteria.Read the full article
Understand the limitations of third-party market traffic estimates
Found this guide helpful? Share it with someone who needs it
Lifestyle
How to Use the Ansoff Matrix: Four Options for Expanding Products and Markets
The Ansoff matrix maps four growth paths using existing or new products and markets: market penetration, market development, product development and diversification. An original canvas goods studio example shows how to define the current business and compare the capabilities and evidence each path needs. A comparison table, steps and original diagrams turn growth ideas into small, testable plans, without treating the model as a success-rate table.
Lifestyle
How to Write Marketing Copy: Clarify Value, Conditions, and Next Steps
Marketing copy should explain who it suits, its value, conditions, and what happens next. Using an original journal-binding workshop example, this article revises information hierarchy, features and benefits, evidence for claims, and action buttons step by step. A before-and-after table and original diagrams show how to retain appeal without overstating promises, and check that prices, limits, images, and links align before publication.
Lifestyle
Customer Journeys and Marketing Funnels: Find Where Readers Drop Off
Customer journeys explain touchpoints and needs; marketing funnels count people at each step using consistent criteria. Using an original bicycle repair booking example, this article explains how to map online and offline contacts, define completion events, calculate step conversion rates, and set up GA4 open or closed funnels. A calculation table, practical steps, and original diagrams help identify improvement hypotheses to test without mistaking data gaps for causes of customer drop-off.
Lifestyle
Planning Brand Identity: CIS, Logos and Website Colors
Brand identity connects business ideas, public-facing behavior and visuals; a logo is only one part. Using an original example of a desk-side stationery studio, this guide covers CIS, MI, BI and VI basics, brand briefs, logo use and website color rules, with steps, a comparison table and original diagrams. It helps small brands clarify uses and acceptance criteria before commissioning design, avoiding a delivery of image files without guidelines they can keep using.
Sources
- BCG's Official Explanation of the Growth-Share MatrixChecked:
- Bruce Henderson: The Product Portfolio, 1970Checked:
- BCG Classics Revisited: 2014 Matrix Review (PDF)Checked:
Compiled from the references and verification dates listed above; fares, schedules, product features, and terms can change, so please confirm the latest details on the relevant official website before travelling, booking, or purchasing.