Lifestyle
How to Improve Core Web Vitals: Find Bottlenecks in Real User Data
When Core Web Vitals flags red items, first identify the affected devices, page groups, and user actions. Using a small course website in Taiwan as an example, this article explains the experience issues behind LCP, INP, and CLS, the roles of real user data and lab tests, reproduction records for engineers, and checks after fixes. A comparison table and original diagrams help avoid major site changes based on a single score.
About 8 min read
Contents
- 1. Understand the Three Metrics and Keep Their Units
- 2. Read Real User Data First, Then Use Tests to Find Causes
- 3. When LCP Is Slow, Trace the Main Content's Path to Appearance
- 4. When INP Is High, Reproduce the Slow Action
- 5. When CLS Is High, Find What Pushes Content Away
- 6. Prioritize by Impact, Then Verify in Two Stages
A course page's main image takes ages to appear, selecting a date does nothing, and the registration button suddenly moves down just as you are about to press it. These are three different frustrations. Core Web Vitals examines loading, interaction, and layout stability separately, helping website managers turn “the website is slow” into more clearly defined improvement tasks.
Before starting, write down the scenario readers encountered and which data identified the issue. Reports can highlight areas needing attention, but they cannot automatically tell you whether the server, images, or code caused the problem. Following the user scenario to find the bottleneck, then planning fixes and verification, makes it easier to confirm the cause than enabling every acceleration option at once.
Understand the Three Metrics and Keep Their Units
LCP tracks how long it takes for the main large content within the viewport to appear, which may be an image or text. INP tracks responsiveness from a user's click, tap, or keyboard action to the next screen update. CLS measures unexpected layout shifts; it is neither a wait time in seconds nor a direct measure of how many pixels something moves.
As of the verification date, Google's thresholds for “good” are LCP of no more than 2.5 seconds, INP of no more than 200 milliseconds, and CLS of no more than 0.1. Assessments usually use the 75th percentile and separate mobile from desktop. This means at least three-quarters of observed experiences are at that value or better, rather than averaging everyone's results.
There is no combined score in which the three metrics offset one another. A fast main image cannot compensate for a severely lagging button, and one good desktop test cannot represent every mobile user's experience. Record the name, value, unit, device, and data scope together first, so different results do not get mixed up when discussing them.
Read Real User Data First, Then Use Tests to Find Causes
Search Console's Core Web Vitals report groups URLs with similar experiences, making it useful for seeing which pages an issue affects. Example URLs in a group are not a complete list, nor do they mean that every visit to every URL is equally slow. The report may not appear when there is insufficient data, so a blank report cannot be read as a pass for everything.
PageSpeed Insights' real user data comes from CrUX and covers the past 28 days. Distinguish data for the current URL from data for the entire website origin; if a page has too few samples, origin-level data may be shown instead. If a course detail page shows a site-wide aggregate, you cannot directly attribute the issue to the course's main image in front of you.
Lab tests can reproduce issues under relatively consistent conditions, making them useful for checking changes. A standard Lighthouse page-load test has no actual user interaction and cannot directly measure INP. TBT can provide clues about blocking, but they are different metrics. For interaction issues, you still need to walk through the actual workflow.
When LCP Is Slow, Trace the Main Content's Path to Appearance
First confirm the LCP element identified by the test; do not assume it must be the cover image. A course page may feature a large image as its main content on desktop, but title text on mobile. Record the screen and element so you know which resource to inspect and whether different layouts need different fixes.
Google's diagnostic method breaks the time down into the initial server response, the delay before resource loading starts, download time, and the delay between download completion and rendering. If the page's HTML already arrives late, shrinking the image alone may offer limited help. If an image has finished downloading but still does not appear, also check the other work its rendering is waiting for.
A record for engineers could say, “The main image on the mobile course page appears only after a certain piece of code finishes,” with the corresponding loading record attached. This is more specific than simply requesting a hosting change. Target the confirmed source of delay, then compare using the same layout and conditions to avoid combining results from different pages.
When INP Is High, Reproduce the Slow Action
List actions readers commonly perform, such as expanding the course outline, switching dates, and selecting the number of participants. Perform each action both just after entering the page and after loading finishes. Some lag occurs only while the code is busy starting up; waiting until the screen is completely stable before clicking once may miss the real issue.
An interaction can be broken down into the wait before event handling begins, execution of the event handler itself, and subsequent rendering. Engineers can use the records to identify long tasks, heavy event handling, or layout update work. A small download does not mean the code requires little processing, and a cache hit does not guarantee that buttons respond promptly.
If pressing a button immediately displays a processing message, but the backend takes a while to return the registration result, also record the time to complete the whole task. INP focuses on interaction response; it is not the total time to complete an order or query data. Verification must check both immediate visual feedback and a correct final result.
- Choose an affected page and a specific interaction, and record the device and login status.
- Perform the action both during loading and after it finishes, and record steps that reproduce the issue.
- Have an engineer record a performance trace to locate the waiting, processing, or rendering stage.
- After the change, use the same steps to recheck responsiveness and functional results, keeping before-and-after records.
When CLS Is High, Find What Pushes Content Away
Layout shifts commonly involve images without reserved dimensions, embedded content, or dynamically inserted blocks, and may also relate to font loading. If a notification bar appears late on a course page and pushes the registration button down, readers see the button move, but the notification bar above it may be what needs inspection.
The shifted elements listed by diagnostic tools are not necessarily the source of the shift. Observe the screen before and after the movement, and check content above that was added or grew larger. Reserve space matching the aspect ratio of images and videos, and design suitable loading positions for dynamic blocks. Do not use oversized blank spaces as a blanket fix, making the mobile page difficult to read.
Shifts may also occur while scrolling or when content is added after the initial load. Read from the top of the page to the bottom, and interact with the sections readers actually use. Low CLS in an initial-load test does not rule out layout issues over an entire visit; visual records of a reproducible issue are more useful than a single screenshot of a score.
Prioritize by Impact, Then Verify in Two Stages
Organize each issue by device, page group, metric, specific scenario, impact, owner, and rollback method. Address severe issues affecting important workflows first, then assess whether a shared layout can improve multiple pages at once. Issues found only on a few particular pages do not require an immediate change to site-wide settings.
In the first stage, check that the change has been deployed to the intended environment, that the reproduction steps show improvement, and that forms, menus, and registration still work. In the second stage, track real user data. Because reports include the past 28 days, a fix today does not make historical data disappear immediately; mark the change date in your records.
Starting tracking in Search Console initiates a monitoring process; it does not reindex the site. Continue watching the scope and values while checking whether traffic sources and the device mix have changed. Define completion as a fixed issue with verifiable acceptance evidence, rather than simply writing “an acceleration plugin has been installed.”
Read the full description
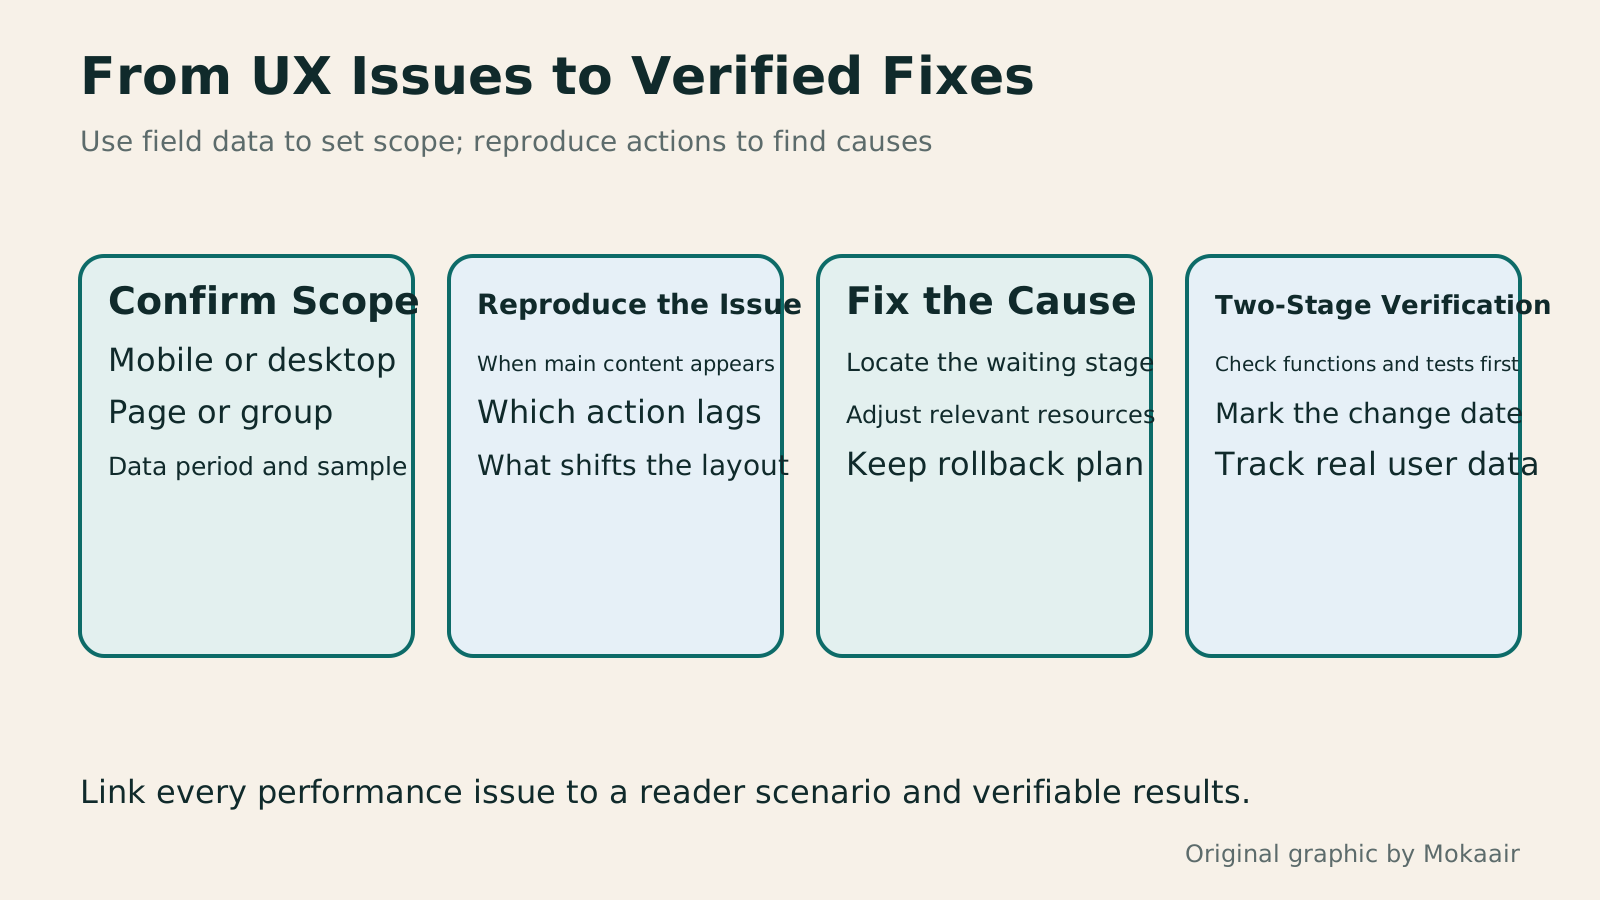
Four sections show, in order, data scope, issue reproduction, fixes targeting the cause, and verification of immediate functionality and subsequent real user data.
| Metric | Good Threshold | Issue to Locate First |
|---|---|---|
| LCP | ≤ 2.5 seconds | Where the main content is waiting |
| INP | ≤ 200 milliseconds | Which interaction responds slowly |
| CLS | ≤ 0.1, unitless | What unexpectedly moves visible content |
Build a Routine Search Console Checking Process
Organize Website Image Production and VerificationHow to prepare website images: Size, alt text, and search readabilityClear, useful website images take more than a compression plugin. Starting from a typical website editor's workflow in Taiwan, this guide covers each image's purpose, dimensions and format, file name, alt text, WordPress upload checks, and the scope of Smush. An original herb-repotting example, checklist, and comparison table show how to keep masters, review images individually, and test the public page for readers and search systems.Read the full article
Plan Website Maintenance and Change RecordsWhat website maintenance involves: a routine for backups, updates, and incident reportsWebsite maintenance includes more than plugin updates: check content, accounts, backups, outgoing email, and expiring services. Using a small WordPress content site, this guide covers routine observation, pre- and post-update checks, restoration, and incident reports, with a worksheet for owners, editors, and maintainers. Set a schedule by update frequency, identify urgent cases, and keep records the next collaborator can use.Read the full article
Found this guide helpful? Share it with someone who needs it
Lifestyle
www, Subdomains, and Subdirectories: Choosing a Website URL Structure
Whether to use www or put a blog at blog.example.com or example.com/blog/ depends on platform support and maintenance. This article explains hostnames and paths, then compares content roles, DNS settings, HTTPS certificates, and URL consistency for subdomains and subdirectories. An original decision table and launch checklist help small websites in Taiwan build URL structures that are easy to use, manage, and hand over.
Lifestyle
Before Hiring a Web Design Agency: The Brief, Quotes and Deliverables Checklist
Before hiring a web design agency, define your site's audience, key actions and deliverables so you can compare quotes. Using a small studio as an example, this guide covers page and template counts, content duties, feature specs, mobile and accessibility checks, account and source-file handover, and post-launch maintenance terms. An editable requirements checklist helps reduce extra costs and communication gaps; no agency recommendations are included.
Lifestyle
How to Start a Web Design Project: Requirements, Content, and Acceptance Testing in Order
Building your first website often stalls over unclear requirements, content, and acceptance criteria, rather than colors. Using an original neighborhood repair studio example, this guide covers user interviews, content preparation, prototyping, development, and handover, with deliverables for each stage. Steps, a comparison table, learning resources, and original diagrams help readers building or commissioning a site turn “Is it finished?” into tasks they can verify.
Lifestyle
Website Caching and CDNs: Which Layer to Clear When Updates Do Not Appear
A website may be updated while phones still show old content because caches remain in different places. Using a Taiwan studio's business-hours update, this article explains browser, WordPress/hosting and CDN roles, cache responses, expiry times and targeted purging. An ordered procedure, comparison table and original diagram help site managers trace old versions while keeping account and shopping workflows correct.
Articles that cite this one
Sources
- Google Web Vitals Definitions and MeasurementChecked:
- Google LCP Diagnosis and ImprovementChecked:
- Google INP Diagnosis and ImprovementChecked:
- Google CLS Diagnosis and ImprovementChecked:
- Search Console Core Web Vitals ReportChecked:
- PageSpeed Insights Data ExplanationChecked:
Compiled from the references and verification dates listed above; fares, schedules, product features, and terms can change, so please confirm the latest details on the relevant official website before travelling, booking, or purchasing.