Lifestyle
How to Read PageSpeed Insights Scores: The Right Order for Measuring Website Speed
Fluctuating PageSpeed Insights scores do not always mean the site has changed. For website managers in Taiwan, this article distinguishes real-user data, Lighthouse tests and score categories, and establishes comparable URLs, devices, versions and test conditions. An original report-reading sequence, improvement log and practical steps help speed checks support concrete decisions instead of merely collecting a high-score screenshot.
About 8 min read
Contents
- 1. Choose representative pages and record the test's purpose
- 2. Read real-user data separately from the current test
- 3. Read raw metrics and categories, not just the score circles
- 4. Keep conditions consistent so repeated results can be compared
- 5. Turn recommendations into actionable, verifiable tasks
- 6. Choose the next tool when the data does not match
If the same website scores green in the morning and orange in the afternoon, does that mean your recent optimization has stopped working? Do not rush to conclusions. PageSpeed Insights shows both real-user data collected over a period and a single simulated page-load test. Their scope and purposes differ, so you should not combine all the numbers into one report card.
Read reports in this order: what is being tested, where the data comes from, which values are unusual, and how to arrange comparisons. This article focuses on keeping measurement methods consistent so that changes have traceable before-and-after evidence. When code or the server actually needs fixing, give the person responsible a clearly defined problem.
Choose representative pages and record the test's purpose
Do not test only the homepage. On a small studio's website, for example, the homepage, portfolio list, individual project pages and contact page may use different templates and resources. Choose a representative URL for each and note whether you want to check how quickly content first appears, how images load, or whether a particular redesign has increased the load.
Enter the full URL in PageSpeed Insights and run the analysis. Once it finishes, confirm that the tested page matches what you expected. If redirects occur from HTTP to HTTPS, through a domain alias or from an old path, record the final destination page too. If the test reaches an error page, login page or website security notice, that score cannot represent the original content page.
Record the URL, test date, page version and selected mobile or desktop view. Mobile results can highlight problems under resource constraints, but they still reflect the tool's settings, not every reader's actual phone in Taiwan. Before comparing reports, confirm that both use the same assumptions.
Read real-user data separately from the current test
The report's real-user data comes from the Chrome User Experience Report, CrUX, using observations from the past 28 days. It helps assess readers' experiences on real devices and networks, but new pages or pages with too few samples may have no data. Record this as unable to assess, not a score of zero or a failed test.
Check whether the displayed data covers this URL or the site origin. If there is insufficient data for an individual page, the tool may use an origin-level aggregate instead. If a project page has only sitewide data, label that scope; do not call it “this project's real-world speed” in a presentation. Recheck the data after switching devices too.
The diagnostics below come from Lighthouse analyzing the current page in a simulated environment, making them useful for finding reproducible loading problems. It is normal for them to differ from historical data: an image you just adjusted may already be reflected in the current test, while past usage data still includes visits before the change. Keep the time period for each section separate to interpret them reasonably.
Read raw metrics and categories, not just the score circles
Lighthouse provides separate categories such as Performance, Accessibility, Best Practices and SEO. The performance score combines several measurement metrics after conversion and weighting; it is not “the percentage of all readers who find the site fast.” Categories are not interchangeable either. A high SEO score cannot prove that an article will achieve a particular search ranking.
The official thresholds label scores of 90 or above as good, 50 to 89 as needing improvement, and below 50 as poor, but the colors are only a starting point. Expand the metrics and check values such as when the main content appears, blocking and layout shifts to identify what to investigate next. Do not break necessary features just to turn 99 into 100.
Tool versions may change the weighting or audit items, so overall scores from different versions are not necessarily directly comparable. Saving the report's version and raw values is more useful than keeping only a score. Check metric names in older tutorials against the current report too; do not assume retired metrics will appear in every new test.
Keep conditions consistent so repeated results can be compared
Even without code changes, third-party content, server load or network conditions may vary. Lighthouse's official guidance recommends repeated measurements and examining their distribution. For a routine editorial check, start by running several tests sequentially under the same conditions, saving every result and the median. Do not delete poorer results and keep only the best-looking run.
If you test with DevTools on your own computer, other tabs, extensions and tasks running at the same time may affect the results. Avoid running multiple Lighthouse tests simultaneously on the same computer, and keep the test environment consistent. An incognito window can reduce some interference, but it cannot guarantee that all hardware or background resource differences are eliminated.
Login status, cookies, promotional banners and cache settings should also remain consistent. If you temporarily remove third-party components that normally appear on the page, label it as a test to isolate a cause; do not present it as the live page's performance. Every result should answer the same question to deserve a place in a before-and-after comparison table.
- Use the same URL and page template, and save version information from before the changes.
- Keep the device view, testing tool, and controllable login and cache conditions consistent.
- Run multiple measurements sequentially, keeping all reports and representative results.
- Change only one group of items with a shared cause, then compare again under the same conditions.
Turn recommendations into actionable, verifiable tasks
Open each diagnostic item, identify the files, elements and causes involved, then record which part of the user experience it affects. Oversized portfolio images and heavy code execution need different solutions. Simply sending engineers the whole report and asking them to “make everything green” can waste time on items with little impact on current readers.
The tool's estimated time savings are clues to support judgment. Do not simply add every row together and promise that the entire page will become faster by that many seconds. Different items may affect the same part of the loading process. Each task should specify the resources or metrics expected to improve, the scope of changes, how to revert them, and checks for necessary features.
For example, a studio's portfolio list could first address the delivery of oversized thumbnails. After making the change, verify which image version actually loads on mobile and its quality, then compare metrics under the same conditions. If the numbers do not change noticeably, keep the results and investigate the bottleneck again. You do not need to switch comparison targets to prove that the change worked.
Choose the next tool when the data does not match
PageSpeed Insights is mainly suitable for webpages that can be accessed remotely. For pages requiring login or local development environments, use Lighthouse in Chrome DevTools as appropriate; it can test pages the browser can access. Check settings such as clearing storage to avoid unknowingly changing the state you intend to test.
If the problem occurs during clicks, scrolling or changes after loading, a single page-load report may be insufficient. Chrome's official guidance recommends the Performance panel for deeper performance diagnostics. Lighthouse also offers different modes, but their audits are not identical. First describe the interaction you need to reproduce, then choose a suitable measurement method.
Finally, save the reports, change logs and actual functional results. If real-user data does not yet reflect the changes, specify the period and scope that still need observation. A completed speed check should explain what was tested, which problem improved and what limitations remain, rather than leaving only a high-score image with no date or URL.
Read the full description
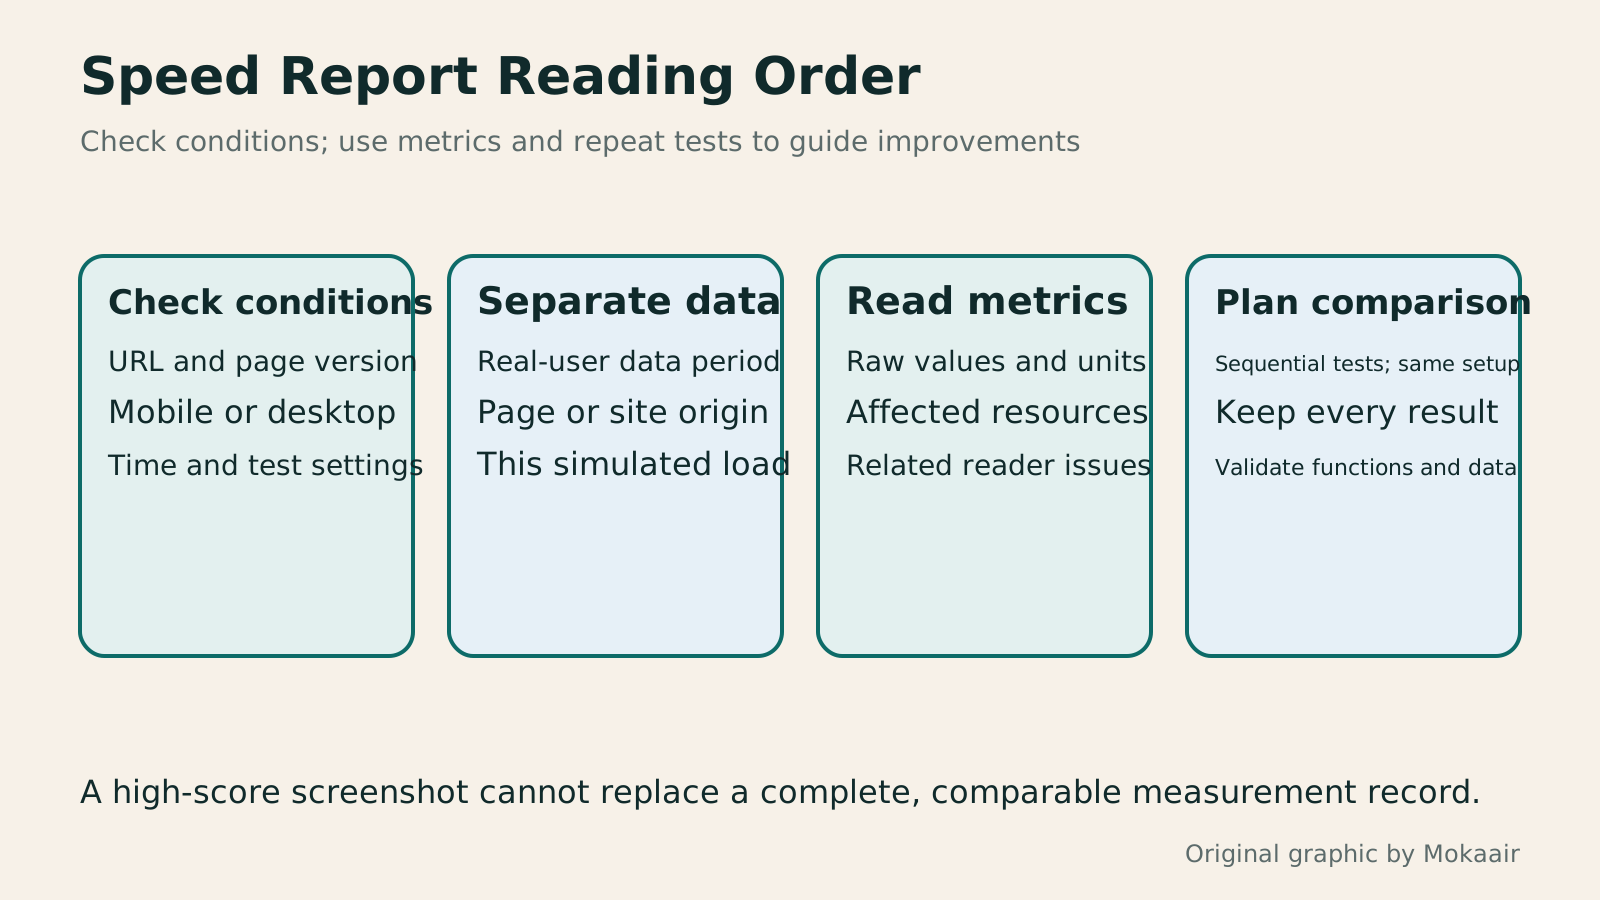
Four steps: confirm the tested page and conditions, distinguish data sources, read specific metrics, and save comparable before-and-after results.
| Report content | Questions it can answer | What you cannot directly infer |
|---|---|---|
| CrUX real-user data | What past user experiences were like | That everything improved immediately after a change |
| A single Lighthouse test | Which loading problems occur under these conditions | Actual speed for every reader |
| Overall performance score | An overview using the tool's weighting | An exact percentage of satisfied readers |
| Diagnostic items | Which resources deserve investigation | That savings from each item can simply be added |
| Repeated records under the same conditions | Whether changes appear consistently | That results across versions and devices can all be mixed in comparisons |
Find user-experience bottlenecks with Core Web VitalsHow to Improve Core Web Vitals: Find Bottlenecks in Real User DataWhen Core Web Vitals flags red items, first identify the affected devices, page groups, and user actions. Using a small course website in Taiwan as an example, this article explains the experience issues behind LCP, INP, and CLS, the roles of real user data and lab tests, reproduction records for engineers, and checks after fixes. A comparison table and original diagrams help avoid major site changes based on a single score.Read the full article
Check image dimensions and text descriptionsHow to prepare website images: Size, alt text, and search readabilityClear, useful website images take more than a compression plugin. Starting from a typical website editor's workflow in Taiwan, this guide covers each image's purpose, dimensions and format, file name, alt text, WordPress upload checks, and the scope of Smush. An original herb-repotting example, checklist, and comparison table show how to keep masters, review images individually, and test the public page for readers and search systems.Read the full article
Set the order for technical SEO checksTechnical SEO audit order: crawling, indexing, rendering, and site structureA useful technical SEO audit needs reproducible evidence and a sensible repair order. Using a site relaunch as an example, this guide explains how to sample page templates and check public access, indexing directives, JavaScript rendering, canonical URLs, and site structure. It separates urgent repairs, scheduled improvements, and later observation so that a general site owner can hand actionable findings to maintainers without treating a passing test as a ranking guarantee.Read the full article
Found this guide helpful? Share it with someone who needs it
Lifestyle
www, Subdomains, and Subdirectories: Choosing a Website URL Structure
Whether to use www or put a blog at blog.example.com or example.com/blog/ depends on platform support and maintenance. This article explains hostnames and paths, then compares content roles, DNS settings, HTTPS certificates, and URL consistency for subdomains and subdirectories. An original decision table and launch checklist help small websites in Taiwan build URL structures that are easy to use, manage, and hand over.
Lifestyle
Before Hiring a Web Design Agency: The Brief, Quotes and Deliverables Checklist
Before hiring a web design agency, define your site's audience, key actions and deliverables so you can compare quotes. Using a small studio as an example, this guide covers page and template counts, content duties, feature specs, mobile and accessibility checks, account and source-file handover, and post-launch maintenance terms. An editable requirements checklist helps reduce extra costs and communication gaps; no agency recommendations are included.
Lifestyle
How to Start a Web Design Project: Requirements, Content, and Acceptance Testing in Order
Building your first website often stalls over unclear requirements, content, and acceptance criteria, rather than colors. Using an original neighborhood repair studio example, this guide covers user interviews, content preparation, prototyping, development, and handover, with deliverables for each stage. Steps, a comparison table, learning resources, and original diagrams help readers building or commissioning a site turn “Is it finished?” into tasks they can verify.
Lifestyle
Website Caching and CDNs: Which Layer to Clear When Updates Do Not Appear
A website may be updated while phones still show old content because caches remain in different places. Using a Taiwan studio's business-hours update, this article explains browser, WordPress/hosting and CDN roles, cache responses, expiry times and targeted purging. An ordered procedure, comparison table and original diagram help site managers trace old versions while keeping account and shopping workflows correct.
Articles that cite this one
Sources
- Google PageSpeed Insights DocumentationChecked:
- How Lighthouse Performance Scoring WorksChecked:
- Official Lighthouse Documentation on Measurement VariabilityChecked:
- Chrome DevTools Lighthouse PanelChecked:
- Getting Started with Lighthouse and Saving ReportsChecked:
Compiled from the references and verification dates listed above; fares, schedules, product features, and terms can change, so please confirm the latest details on the relevant official website before travelling, booking, or purchasing.