Lifestyle
How to Use PESTLE: Turn External Changes into Business Risks
PESTLE checks political, economic, social, technological, legal and environmental change; sorting news into six boxes is not enough. Using an original example of a camping gear rental shop, this guide sets scope, selects primary sources, separates announcements from assumptions and links signals to demand, costs and service processes. A six-factor comparison table, practical steps and original diagram help build a watchlist with indicators, owners and review dates.
About 8 min read
Contents
- 1. First define the area, period and decision
- 2. Political and legal factors: check document status first
- 3. Economic and social factors: check the scope of the data
- 4. Technological and environmental factors: distinguish trends from practical use
- 5. Map an impact pathway for every external signal
- 6. Turn observations into conditional decisions
A camping gear rental shop is preparing to expand its inventory. The team sees news about tourism, prices and weather, but does not know which developments will actually affect the shop. Sorting news into six columns is only the beginning; the team also needs to explain how changes feed through to customer demand, gear turnaround or service costs.
This article demonstrates external environment analysis using CIPD methodology, guidance from Taiwan's Directorate-General of Budget, Accounting and Statistics (DGBAS), and Taiwan's Central Weather Administration (CWA) data portal, consulted on 2026-9-14. The rental shop and all scenarios are original examples. No unverified market growth rates are cited, and no definitive predictions are made about future weather or policy.
First define the area, period and decision
PESTLE covers six factors—political, economic, social, technological, legal and environmental—to identify external influences that may affect an organization. It examines the business environment. Internal problems, such as inadequate staff training or incomplete gear maintenance, should be documented separately, then assessed alongside external changes.
Before starting, record the shop's service area, current customer groups, product range and decision period. For example, "Assess whether to add more tents for family use over the next six months" makes it easier to find relevant data than "Analyze the camping industry." National tourism trends may provide useful context, but cannot be equated directly with rental demand at a particular pickup location.
The six factors do not need equal amounts of data, and a change does not always belong in only one box. A policy may involve both legal and environmental factors; simply record its main category and link the related impacts. The point is to avoid counting the same factor twice, rather than arguing over which letter it belongs under.
Political and legal factors: check document status first
For political factors, examine policy direction, public infrastructure or administrative arrangements. For legal factors, check applicable rules and processes that may need adjustment. If the rental shop is monitoring management changes at nearby recreation areas, it can start with the responsible authority's original announcement, then confirm the locations, parties and dates covered. Decisions should not rely solely on social media reposts.
Clearly record each document's status, such as under discussion, draft, announced or in force. A news report that something is being considered does not mean services must change the next day. Even announced arrangements may have phased implementation dates. If it is unclear how the conditions relate to your business, first list the questions to clarify and the responsible contact.
This article does not assume that any camping or rental rule has changed, nor does it provide conclusions about specific regulations. In an actual analysis, record "Which process might be affected, when confirmation is needed, and who will follow up." This lets the team schedule verification even before rules are finalized, without presenting uncertain reports as established facts.
Economic and social factors: check the scope of the data
For economic factors, examine prices, household spending and relevant supply prices, while distinguishing broad economic indicators from your own accounts. DGBAS explains that CPI measures changes in the prices of consumer goods and services purchased by ordinary households. It does not represent the rate of change in every gear item, cleaning supply or delivery expense at a rental shop.
The shop can use official indicators as background, then check supplier quotes against its own cost items. If a tent purchase quote changes, confirm that specifications, quantities, shipping and payment terms are the same before comparing. A single overall price figure is no basis for assuming that all costs and rental fees should change by the same proportion.
For social factors, investigate leisure habits, family needs or user experiences, but avoid inferring preferences directly from age. The shop in this original example may want to know whether first-time campers place greater importance on instruction and convenient pickup and returns. This requires support from interviews or records of customer needs. National demographics can suggest a direction, but cannot replace local customers' actual choices.
Technological and environmental factors: distinguish trends from practical use
For technological factors, monitor developments in booking systems, gear identification, payment and inventory tools. Attention around a technology does not mean the shop needs to adopt it immediately. First ask whether it can solve a current task, such as reducing double-booking on the same date, then check whether existing data, maintenance capabilities and exception handling can support it.
For environmental factors, examine climate conditions, resource use and supply impacts. The Central Weather Administration's CODiS provides a portal for querying climate observation data. To study gear drying and turnaround, consult historical data for the relevant area and record the station, period and data notes. Historical observations help explain the background; they are not a weather forecast for a particular future weekend.
For the rental shop, understanding how rainfall affects returns, cleaning and drying also requires examining actual workflows. This article can propose the hypothesis that "turnaround times may increase under persistently damp conditions," but cannot present it as a measured, fixed loss. When planning calculations or recordkeeping, include equipment and premises conditions as well.
Map an impact pathway for every external signal
Create a monitoring table with fields for source, access date, period covered by the data, external signal, potential impact, points requiring verification and responsible person. The publication date and the event date may differ, so retain both separately. Multiple news reports repeating the same announcement also do not count as independent pieces of evidence.
An original example might read: "A supplier has confirmed a longer lead time for a particular gear model, which may reduce the time available to stock up before peak season; existing inventory and alternatives need checking." This pathway is more specific than "There is supply chain risk" and directly identifies the next step. If the concern is only speculation, arrange to obtain a quote or confirm the lead time before rushing to increase inventory.
You can also compare a few scenarios, such as unchanged lead times, longer lead times or available alternatives, and check which arrangements would change in each case. Scenarios are not probability forecasts; there is no need to invent percentages without supporting data. Completing preparations that remain useful under different assumptions helps avoid basing every decision on a single imagined outcome.
- Define the operating area, products, customer groups and decision period.
- Use the six factors to find relevant primary sources, recording publication dates and applicable periods.
- Link external changes to demand, costs or service processes, marking areas of uncertainty.
- Set monitoring indicators, trigger conditions, responsible people and review dates.
Turn observations into conditional decisions
Prioritize issues by potential impact, timing and how much is currently known. For confirmed issues that will affect delivery soon, adjust work first. For potentially major impacts with insufficient evidence, gather more data first. For trends with little relevance to the current decision, retain the sources; there is no need to redo the entire report every week.
When setting triggers, verifiable events are more useful than vague impressions. For example, recheck processes when a revised official announcement arrives, or begin assessing alternatives when a designated supplier cannot confirm a lead time. The shop should set conditions according to its own capacity to bear risk. This article provides no universal purchasing thresholds or guaranteed inventory figures.
During reviews, record which signals actually had an impact and which assumptions did not hold, then update the sources and analytical scope. When assessing internal capabilities, bring the relevant opportunities and threats into SWOT. When comparing industry competition, use Five Forces analysis. The outcome of PESTLE should be a watchlist that supports subsequent decisions.
Read the full description
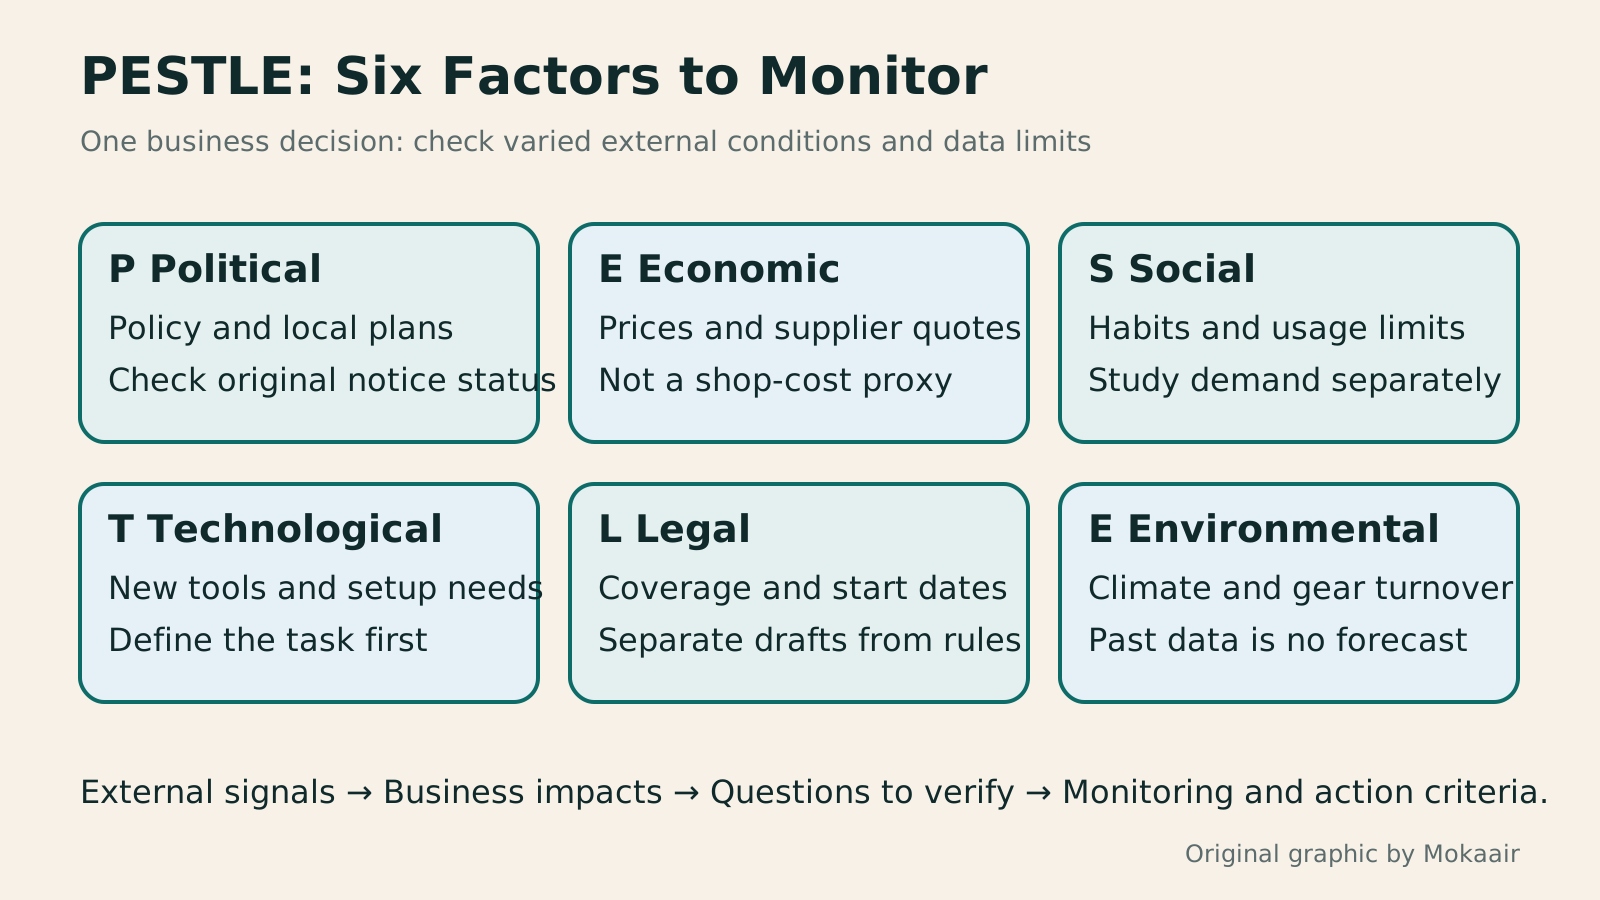
Six cards outline checks for political, economic, social, technological, legal and environmental factors, prompting readers to link signals to specific impacts and monitoring conditions.
| Factor | Questions the rental shop can investigate | Data and interpretation reminders |
|---|---|---|
| Political | Does public administration or infrastructure affect the service area? | Consult the responsible authority's original announcement. |
| Economic | What has changed in purchasing and operating costs? | Keep broad economic indicators separate from the shop's own quotes. |
| Social | Have customers' leisure objectives and constraints changed? | Combine statistical context with research into actual needs. |
| Technological | Can new tools improve gear and booking management? | Check integration, maintenance and exception handling. |
| Legal | Which official rules apply to current operations? | Distinguish drafts, announcements and effective dates. |
| Environmental | How do climate and resource conditions affect turnaround? | Do not treat historical observations as forecasts. |
Bring external factors into SWOT and TOWSSWOT and TOWS: From Strengths and Weaknesses Analysis to an Action ListSWOT maps strengths, weaknesses, opportunities and threats, but filling its four boxes still leaves actions to choose. Using an original small print studio example, this article separates internal and external factors, adds evidence to each judgment, and develops options with the four TOWS pairings. A strategy comparison table, practical steps and original diagrams turn vague adjectives into a task list with owners, deadlines and acceptance criteria.Read the full article
Use interviews to verify customer group needsSTP and Personas: Use Interview Evidence to Decide Whom to ServeSTP helps a team decide whom to serve; personas help it understand customers' tasks and obstacles. Both need evidence. Using a fictional home-organizing service, this guide covers interview planning, separating observations from assumptions, segmenting by need, selecting a target, and testing a position. An evidence table, practical steps, and an original diagram help you avoid inventing a convincing customer from age and imagination alone.Read the full article
Set marketing and review cycles for a small shopHow to write a small-shop marketing plan: goals, customers, and monthly reviewsA small-shop marketing plan can begin with one clear business problem; there is no need to schedule every social channel and ad at once. Using an original example about a florist's weekday orders, this guide works through goals, customers, channel roles, budgets, and monthly reviews. It provides practical worksheet fields, a comparison table, and an original diagram so owners can turn ideas into assigned, trackable actions they can revise. Completing a campaign is not a promise of sales.Read the full article
Found this guide helpful? Share it with someone who needs it
Lifestyle
How to Read the BCG Matrix: Uses and Limits of Product Portfolio Analysis
The BCG matrix maps product portfolios by market growth and relative share; stars, cash cows, question marks and dogs do not establish actual profit. An original home goods store example shows how to define markets, check comparison periods and denominators, understand model assumptions, and allocate resources using costs, turnover and customer needs. Includes a four-category table, practical steps, original diagrams and options when reliable market data is lacking.
Lifestyle
How to Use the Ansoff Matrix: Four Options for Expanding Products and Markets
The Ansoff matrix maps four growth paths using existing or new products and markets: market penetration, market development, product development and diversification. An original canvas goods studio example shows how to define the current business and compare the capabilities and evidence each path needs. A comparison table, steps and original diagrams turn growth ideas into small, testable plans, without treating the model as a success-rate table.
Lifestyle
How to Write Marketing Copy: Clarify Value, Conditions, and Next Steps
Marketing copy should explain who it suits, its value, conditions, and what happens next. Using an original journal-binding workshop example, this article revises information hierarchy, features and benefits, evidence for claims, and action buttons step by step. A before-and-after table and original diagrams show how to retain appeal without overstating promises, and check that prices, limits, images, and links align before publication.
Lifestyle
Customer Journeys and Marketing Funnels: Find Where Readers Drop Off
Customer journeys explain touchpoints and needs; marketing funnels count people at each step using consistent criteria. Using an original bicycle repair booking example, this article explains how to map online and offline contacts, define completion events, calculate step conversion rates, and set up GA4 open or closed funnels. A calculation table, practical steps, and original diagrams help identify improvement hypotheses to test without mistaking data gaps for causes of customer drop-off.
Articles that cite this one
Sources
- CIPD: PESTLE Analysis MethodChecked:
- Taiwan Directorate-General of Budget, Accounting and Statistics: What CPI MeasuresChecked:
- Taiwan Directorate-General of Budget, Accounting and Statistics: Price Statistics Table PortalChecked:
- Taiwan Central Weather Administration: CODiS Climate Observation DataChecked:
Compiled from the references and verification dates listed above; fares, schedules, product features, and terms can change, so please confirm the latest details on the relevant official website before travelling, booking, or purchasing.