Lifestyle
Finding article ideas with Google Trends: relative interest, regions and seasons
Google Trends 100 is not a search count, and a darker region is not the number of potential customers. Using a Taiwan home-products example, this guide distinguishes search terms from topics, explains conditions behind relative-interest comparisons, and examines seasons, brief events, and top and rising queries. Steps, a comparison table and an original diagram turn trend signals into a documented, repeatable content plan without treating one spike as proof of rising product demand.
About 7 min read
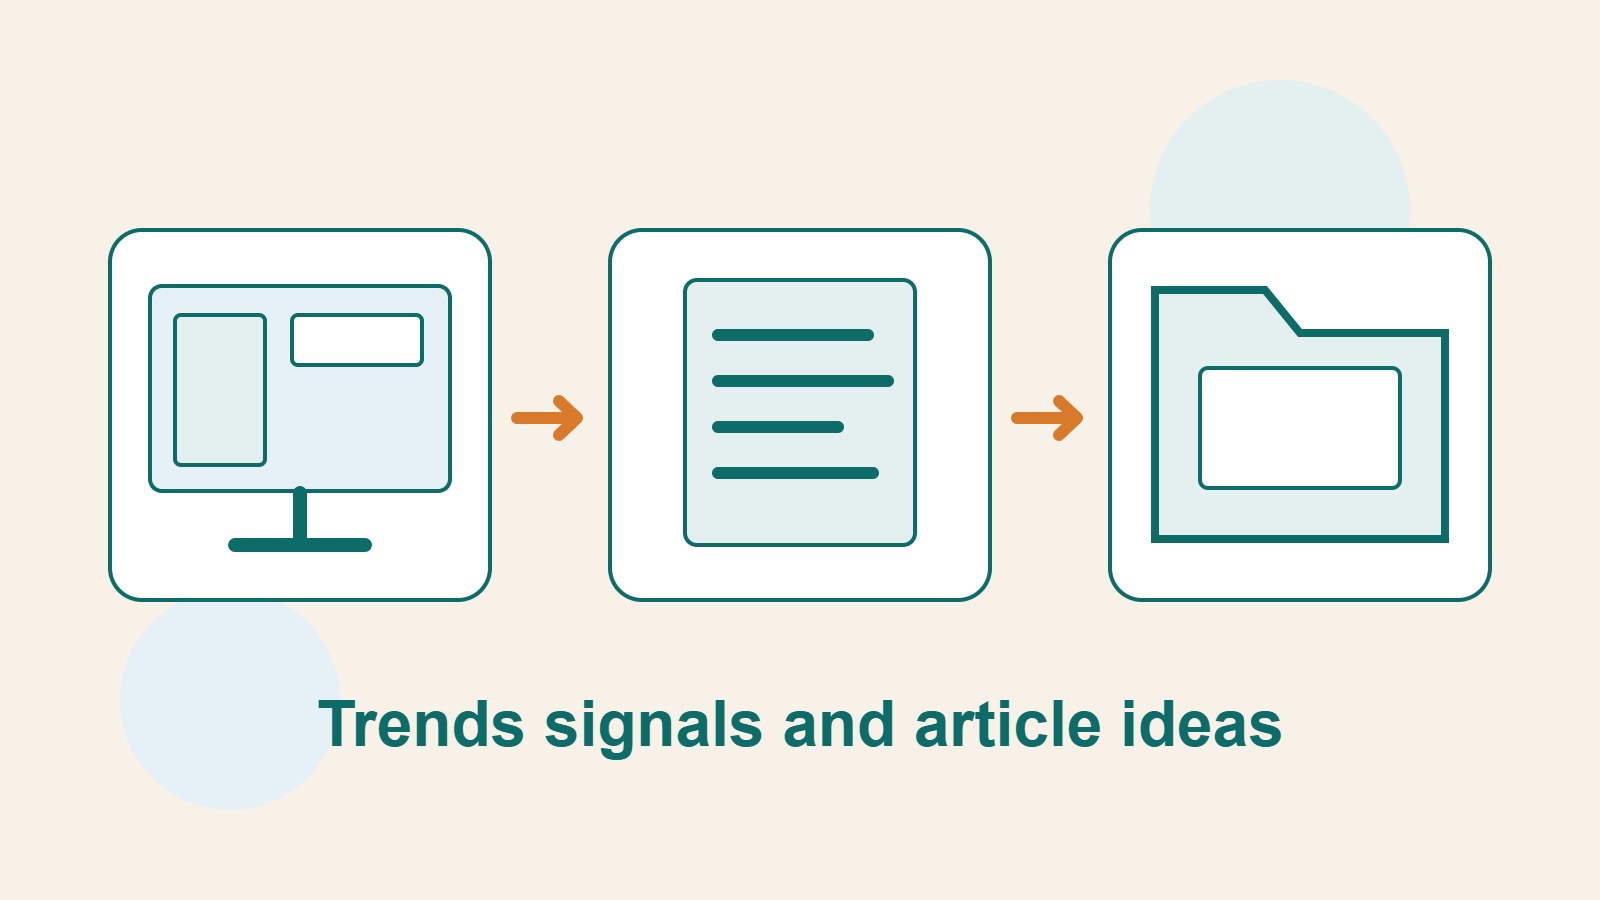
If you are planning an article about home products and want to know whether readers are currently more interested in dehumidifiers or air purifiers, Google Trends can offer a starting clue. Its curves show search interest under particular conditions. They do not tell you directly how many people will buy a product or replace the problems readers actually face.
This guide demonstrates the whole process, from the research question and query settings to an editorial decision table. Dehumidifier examples are research scenarios; they do not claim to show today's top searches in Taiwan. When you use real data, save the query settings and date so an editor can revisit the reasoning.
Write the question first instead of chasing the trending list
Turn a vague wish to find popular topics into a specific question: which kind of home-maintenance content should you prepare for the next quarter, or which of two names for the same product do people search more often? Different questions need different comparison terms and time ranges. You do not have to start with today's biggest news term.
If your site serves households in Taiwan, begin with Taiwan as the region, a fixed search type and a clear category. Web Search and YouTube Search reflect different contexts. Interest in one does not establish the same demand in the other. Record these settings alongside the research question.
Make a simple worksheet with columns for the question, search term or topic, region, date range, search type, category and date checked. Change one condition at a time so you can tell whether a curve changed because interest changed or because you changed the scope yourself.
Choose terms and topics that describe comparable things
After you enter a name, the Google Trends suggestions may offer both search terms and topics. A search term follows the entered wording; a topic can combine names and languages for the same concept. Choose terms when comparing spellings, and consider a topic when researching the broader concept.
For example, if you want to compare two Chinese names used by readers in Taiwan, do not choose a Chinese search term on one side and a broad, multilingual topic on the other, then call the latter more popular. Make the scopes comparable first. If you intentionally compare unlike scopes, state why and explain the limitation.
The same name may refer to a brand, a product or something else. Read the suggestion description and check whether related searches match what you intended. Not every word has a suitable topic; use a precise term and record the limitation if necessary. Google's classification is a starting point, not a substitute for understanding readers.
Read the 0–100 scale as relative interest
According to Google's guidance checked on September 14, 2026, Trends uses an anonymized, aggregated sample of searches, normalizes it to total searches by time and region, then scales relative interest from 0 to 100. A score of 100 is not 100 searches, nor proof that every user cares about the topic.
Change the time range, region or comparison terms and the chart is scaled for the new conditions. Two separate charts both showing 100 therefore do not prove equal search volumes. To compare terms, put them in the same query when possible and save the settings. Do not combine separate charts' peaks into an absolute-volume ranking.
A zero or missing chart does not mean no one has the problem; there may be too little data. Google's guidance also notes possible noise in low-volume searches. One brief spike is not evidence that a particular person searched. For niche questions, check interviews, support requests and other sources too.
Look for repeated seasons and read regional scores as proportions
For a seasonal topic, begin with several years, then zoom in on the latest year to see whether peaks recur around similar times. If only one year spikes, investigate news, promotions or supply events. A curve and an event occurring together suggest a hypothesis to check; they do not prove causation.
In Taiwan, schedules may also follow lunar-calendar holidays, school terms or long weekends. Mark the actual event dates rather than aligning only by the same Gregorian-calendar week and mistakenly concluding that demand moved earlier or weakened. Google Trends' quick comparisons can provide a preceding-period reference, but you still need to decide whether it fits the seasonal question.
A darker map or higher regional score means greater relative search interest there, not necessarily more potential buyers. Two regions with the same score may have different total search volumes. If you are choosing a physical service area, consider travel, supply and what you can actually provide; do not pick a shop location from the map alone.
Find questions in related searches; do not turn growth rates into article quotas
Top and rising related searches serve different purposes. Top searches help reveal questions people often search for in the same session; rising searches highlight those with stronger growth than the preceding period. Sort candidates by needs such as choosing, operating, cleaning or troubleshooting, so different articles answer different problems.
Google defines Breakout as growth of more than 5,000%. It is not a known total number of searches or an order to publish immediately. A term starting from a tiny base can have a large growth rate. Check its meaning, event context and whether you can answer the question before scheduling it.
Suppose a dehumidifier result suggests interest in cleaning the water tank. Investigate whether readers mean removal, washing or an odor problem. If an existing article already answers it fully, update that article with new evidence. Create a separate page only for a genuinely different task. Do not publish one near-duplicate article for every similar phrase.
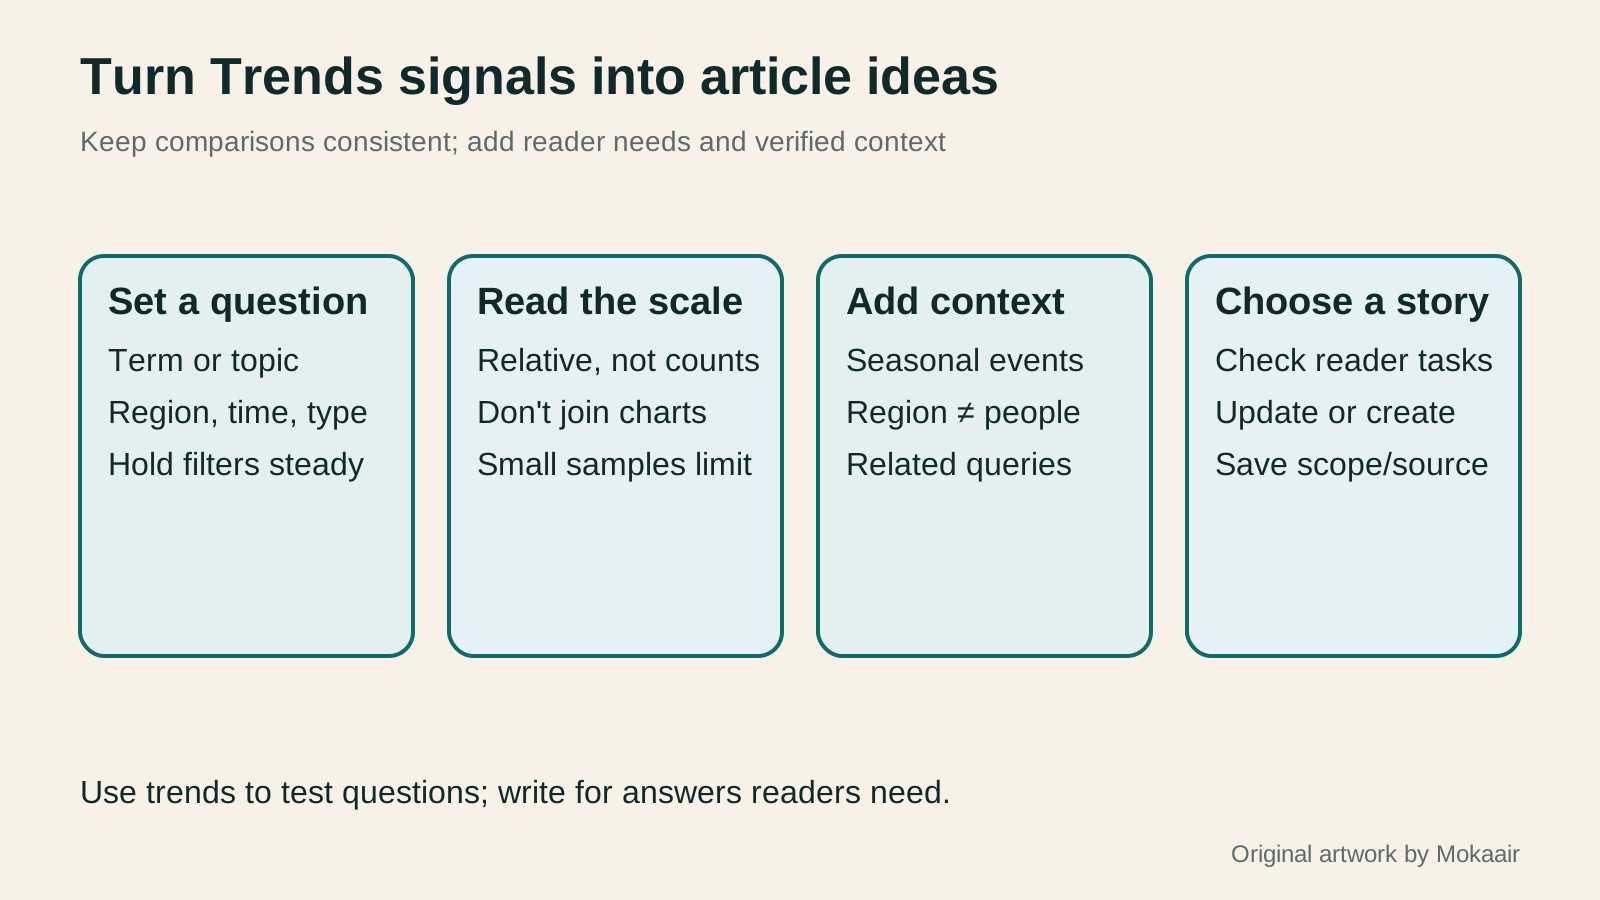
- Write the research question and fix Taiwan, time range, search type and category.
- Check whether each item is a term or a topic, and compare items within the same query.
- Study long-term and seasonal patterns, then examine regions and related searches while noting alternative explanations.
- Export or save the query; use reader questions and existing articles to decide whether to create or update content.
Save the data and decisions so they can be checked later
To retain chart data, use its download control to obtain a CSV and organize it in a spreadsheet. Save the original file, query link and settings, then write your own interpretation separately. Put the date checked and region in the filename so that six months later you are not left with a screenshot whose curve cannot be reproduced.
If an article uses real Google Trends data, attribute it as Google requires and include the scope and date checked. Google Ads search volume and a Trends index are not the same unit. When redrawing a chart, retain the scale explanation instead of letting a polished graphic hide the data limits.
After publishing, check whether the page attracts relevant queries, whether readers find their answer and whether the seasonal hypothesis held. If results differ, record whether timing, content direction or interpretation needs changing. Trends is useful for repeatedly proposing and revising research hypotheses. A maintained editorial record helps more than a pile of saved popular keywords.
| What you see | Initial interpretation | Evidence still needed |
|---|---|---|
| A peak within one query | Interest is higher under those conditions | Events and longer-term context |
| Two separate charts each show 100 | Each chart has its own relative scale | A joint query with the same settings |
| A high regional score | Higher relative interest in that region | Actual audience and service area |
| Rising search marked Breakout | Very large growth over the prior period | Starting volume and meaning of the question |
| Zero for a niche term | Insufficient data is possible | Interviews or other query evidence |
Turn keywords into readers' tasksA keyword research workflow: Reader needs, long-tail queries, and topic prioritiesKeyword research should produce a schedulable content list, not hundreds of unused terms. Using a small baking tutorial site, this guide collects clues from reader questions, Search Console, Google Keyword Planner, and Google Trends. It separates search-volume estimates, ad competition, and relative interest, then groups specific needs, checks existing pages, and prioritizes topics by value and production capacity.Read the full article
Distinguish search intentsHow to Identify Search Intent: Turn Keywords into Questions Worth AnsweringThe same keyword can signal learning, comparison, finding a specific entry point or taking action. Using original luggage-storage examples, this guide shows how to judge intent from wording, time and place, result formats and your own query data, then turn a hypothesis into a clear content task. It includes an observation table, ways to handle mixed intent, content-format choices and later validation. Do not copy ranking pages or treat one search-results screen as the answer for every reader.Read the full article
Group repeated topics and update older articles
Lifestyle
Technical SEO audit order: crawling, indexing, rendering, and site structure
A useful technical SEO audit needs reproducible evidence and a sensible repair order. Using a site relaunch as an example, this guide explains how to sample page templates and check public access, indexing directives, JavaScript rendering, canonical URLs, and site structure. It separates urgent repairs, scheduled improvements, and later observation so that a general site owner can hand actionable findings to maintainers without treating a passing test as a ranking guarantee.
Lifestyle
How to write article titles: Show search readers the scope and purpose
A useful title tells readers before they click what problem an article addresses, when it applies, and what information they will get. Using original rewrites of everyday tutorials, this guide checks the topic, purpose, limits, and evidence behind title promises. It explains why the page heading, HTML title, and Google search title may differ, then offers prepublication checks and post-change observation without stuffing keywords, claiming tests that never happened, or adding an unverified year.
Lifestyle
How to Identify Search Intent: Turn Keywords into Questions Worth Answering
The same keyword can signal learning, comparison, finding a specific entry point or taking action. Using original luggage-storage examples, this guide shows how to judge intent from wording, time and place, result formats and your own query data, then turn a hypothesis into a clear content task. It includes an observation table, ways to handle mixed intent, content-format choices and later validation. Do not copy ranking pages or treat one search-results screen as the answer for every reader.
Lifestyle
A beginner's SEO learning roadmap: make your site readable before measuring traffic and results
SEO beginners need not memorize ranking factors or buy a suite of tools. Using a small Taiwan website, this guide orders five topics: how search works, site readability, content planning, Search Console metrics, and results. Exercises by stage, a resource table, and a change log help you make pages readers and search engines can understand, then plan further work from data instead of tool scores or short-term swings.
Latest travel guides

GuideTokyo
Where to Stay in Tokyo: Comparing Shinjuku, Ueno, Tokyo Station, Shibuya, Asakusa, Ikebukuro, and Ginza, Plus Airport Access, Accommodation Tax, and Luggage Delivery
Where should you stay in Tokyo? Compare Shinjuku, Ueno, Tokyo Station, Shibuya, Asakusa, Ikebukuro, and Ginza by the same criteria: access from Narita and Haneda, transit routes, nearby attractions, neighborhood character, and who each area suits. Includes a comparison table, a Yamanote Line diagram, Tokyo’s accommodation tax as verified in 2026/9 (changing to 3% in 2027/4), and Airport TA-Q-BIN luggage shipping rules.
- Budget
- Hotels

GuideTokyo
How to Choose Tokyo Transit Passes: Are Suica, Welcome Suica, the Tokyo Subway Ticket, and the JR Pass Worth It?
On a first Tokyo trip, start with an IC card and pay per ride (Welcome Suica has no deposit and is valid for 28 days). If you take four or more subway rides in a day, add a 72-hour Tokyo Subway Ticket for 2,000 yen; a JR Pass is never worthwhile if you stay in Tokyo and do not go to Kansai. See what TOURIST PASMO, Suica on iPhone, and the Tokyo Metro day pass do and do not cover, with a decision chart. Prices verified in September 2026.
- Transport
- Budget

GuideTokyo
Tokyo Disneyland and DisneySea Guide: Ticket Prices, Fantasy Springs, Disney Premier Access (DPA), Standby Pass, and Which Park to Choose for Your First Visit
Tokyo Disney one-day Passport prices vary: most weekdays in 9/2026 cost ¥9,900 and weekends ¥10,900. At 14:00 daily, tickets go on sale for the same date two months later. Free Priority Pass is no longer on the official service list; only paid Disney Premier Access (¥1,000–3,500 per person per use) shortens waits. Covers hours, the 25th anniversary, Standby Pass, Entry Request, Fantasy Springs access and first-visit park choice; checked on the official site in 9/2026.
- Itineraries
- Family
Sources
- Google Trends FAQ on data and relative scaling · Checked:
- Google Trends help on search terms and topics · Checked:
- Google Trends help on regional results · Checked:
- Google Trends help on top and rising related searches · Checked:
- Google Trends help on quick time comparisons · Checked:
- Google Trends help on exporting and citing data · Checked: